IGCSE考試今日放榜,成績到底會是怎么樣的?
今天下午CAIE考試局IGCSE,愛德思&牛津AQA考試局A-level的成績將陸續公布!很多同學好奇,IGCSE考試今日放榜,成績到底會是怎么樣的?今天跟隨小編的腳步我們一起來看看哈~ IGCSE成績走向: 過去三年IGCSE熱...

今天下午CAIE考試局IGCSE,愛德思&牛津AQA考試局A-level的成績將陸續公布!很多同學好奇,IGCSE考試今日放榜,成績到底會是怎么樣的?今天跟隨小編的腳步我們一起來看看哈~ IGCSE成績走向: 過去三年IGCSE熱...
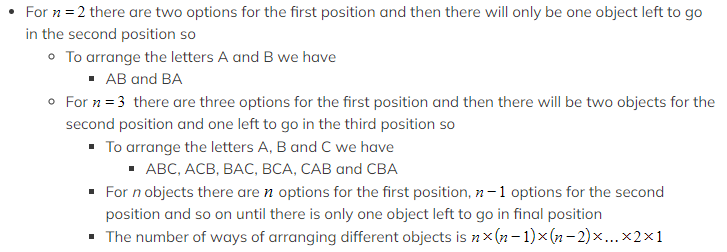
Arrangements How many ways can?n?different objects be arranged? When considering how many ways you can arrange a number of?different?objects in a row it’s a good idea to think of how many of the ob...
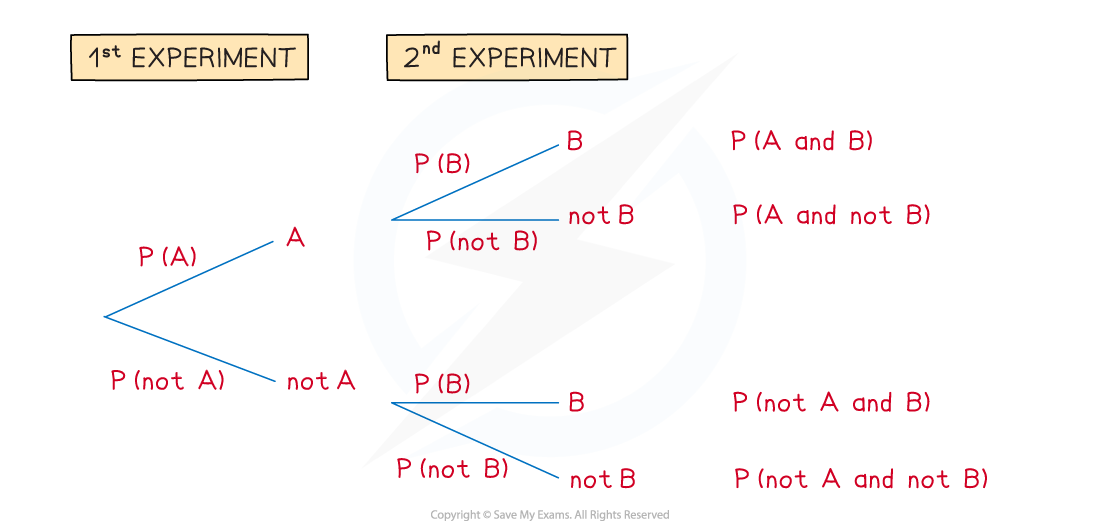
Tree Diagrams What is a tree diagram? A?tree?diagram?is used to show the (combined)?outcomes?of more than one?event?that happen one after the other help calculate probabilities when?AND?and/or?OR’s...

Venn Diagrams What is a Venn diagram? A?Venn?diagram is a way to illustrate?events?and are particularly useful when?outcomes?overlap Venn diagrams are mostly used for 2 or 3 events A Venn diagram c...

Probability Basics What do I need to know about probability for AS and A level Mathematics? The language used in probability can be confusing so here are some definitions of commonly misunderstood ...
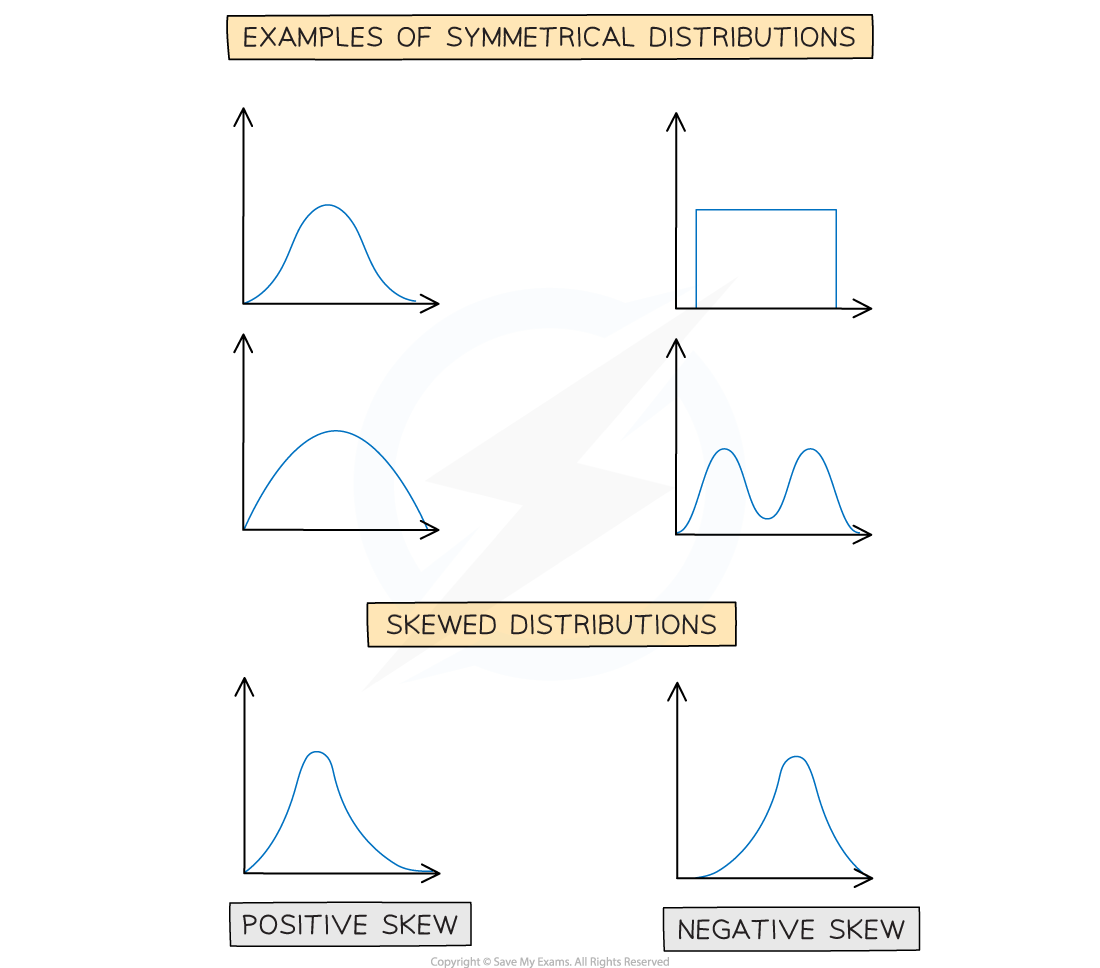
Skewness The distribution of a data set is either symmetrical or it has skewness. What is skewness? Skewness describes the way in which data in a non – symmetrical distribution is leaning A distrib...
Interpreting Data You may be asked to comment on how statistics could affect data or how removing or adding a new piece of data could change statistics you have calculated. You may also be asked to...
Histograms What is a histogram? A histogram is similar to a bar chart but with some?key differences A histogram is for displaying?grouped continuous data?whereas a bar chart is for?discrete?or?qual...
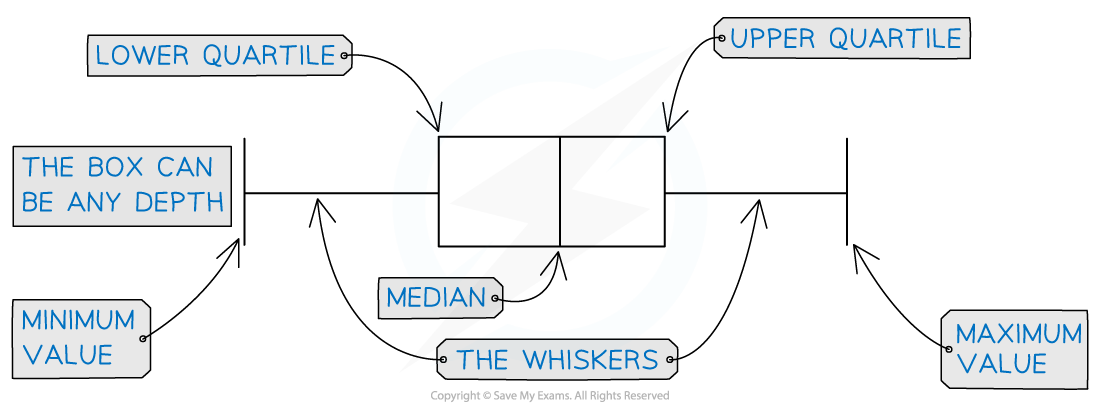
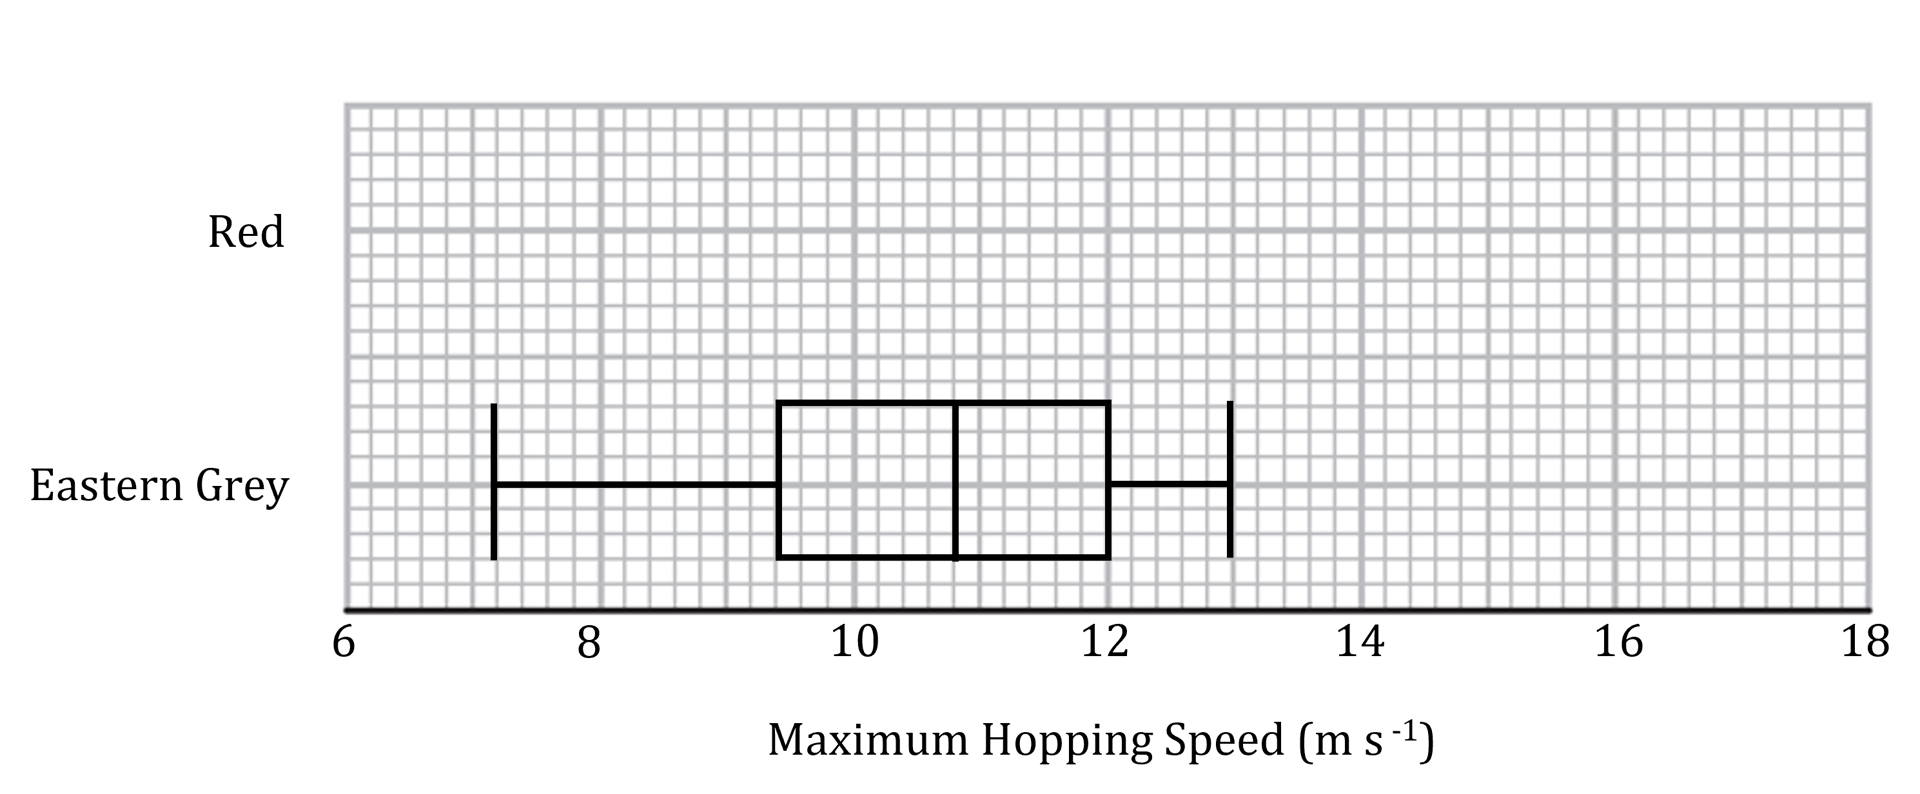
Box Plots What is a box plot? A box plot is a graph that clearly shows key statistics from a data set It shows the?median, quartiles, minimum?and?maximum values?and?outliers It does not show any ot...


