IB DP Maths: AI SL復習筆記4.2.1 Bivariate data
Scatter Diagrams What does bivariate data mean? Bivariate data?is data which is collected on?two variables?and looks at how one of the factors affects the other Each data value from one variable wi...

Scatter Diagrams What does bivariate data mean? Bivariate data?is data which is collected on?two variables?and looks at how one of the factors affects the other Each data value from one variable wi...
Interpreting Data How do I interpret statistical measures? The?mode?is useful for?qualitative data It is not as useful for quantitative data as there is not always a unique mode The?mean includes a...
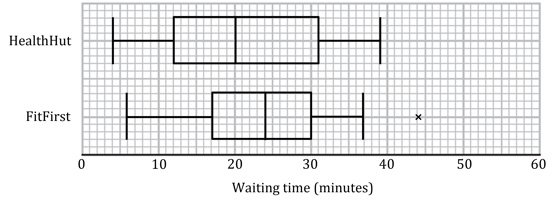
Univariate data is data that is in?one variable. Box Plots What is a box plot (box and whisker diagram)? A box plot is a graph that clearly shows key statistics from a data set It shows the?median,...
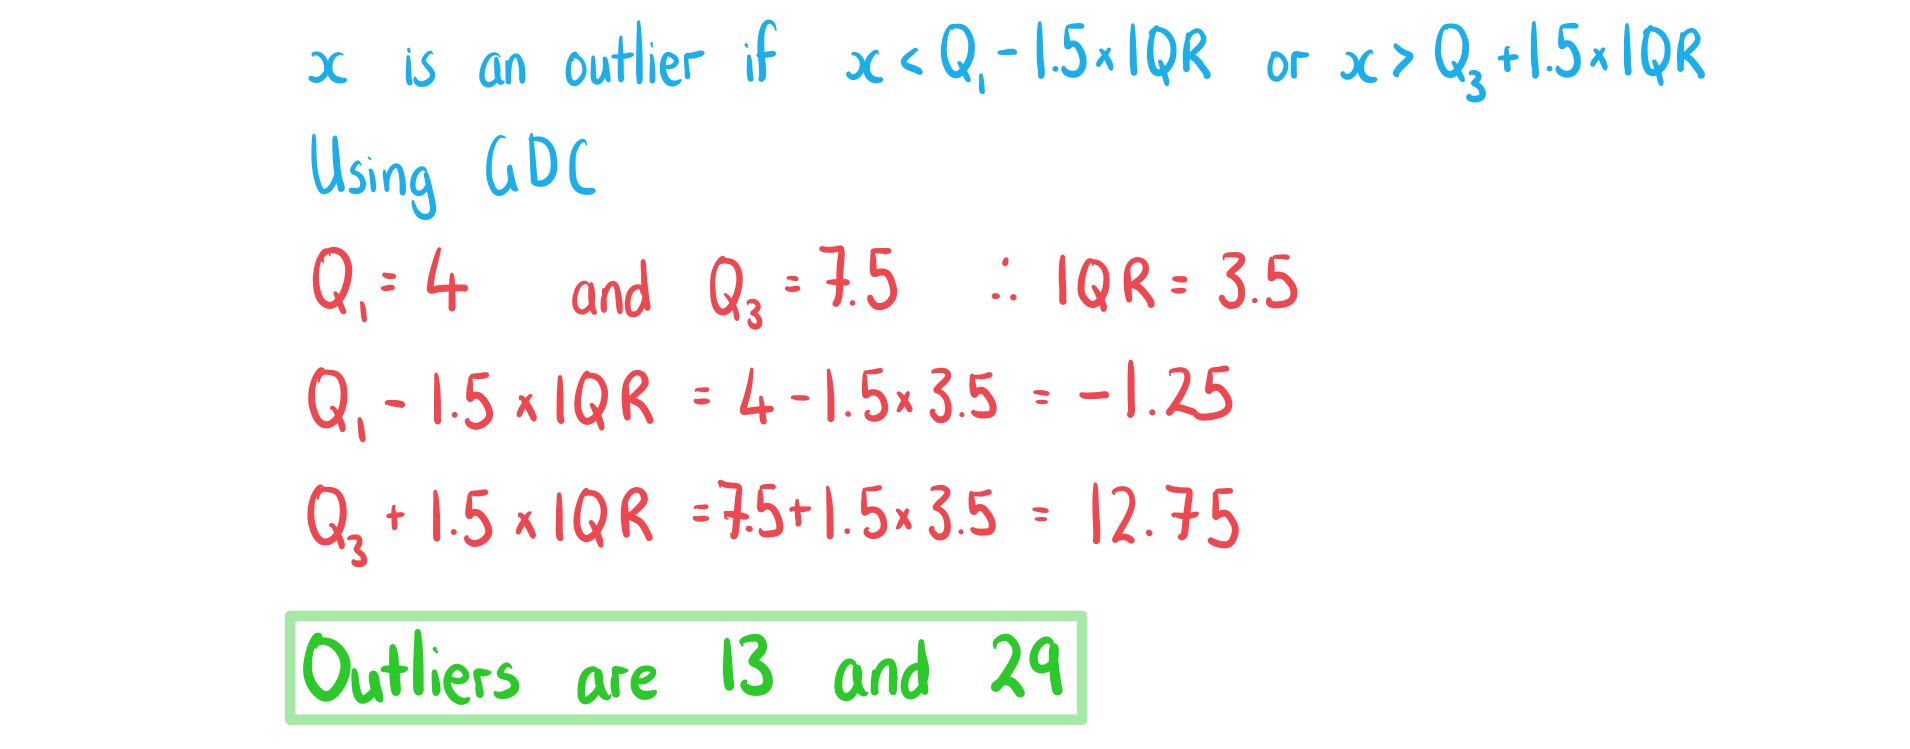
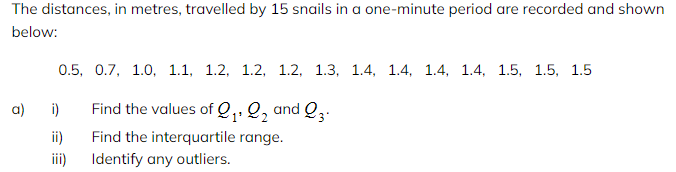
Outliers What are outliers? Outliers are extreme data values that do not fit with the rest of the data They are either a lot bigger or a lot smaller than the rest of the data Outliers are defined a...
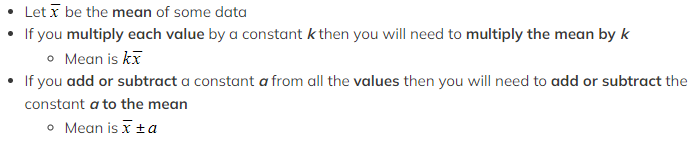
Linear Transformations of Data Why are linear transformations of data used? Sometimes data might be very large or very small You can apply a?linear transformation?to the data to make the values mor...

近幾年來,IB課程的學生越來越受到世界頂尖大學的青睞。特別是在美本申請中,因為IB由于課程難度較高,在藤校及美國TOP30錄取中占有較大優勢。因此,今天我們重點講解一下中文A 部分。 首先,就課程考察內容來說...
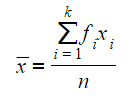
Ungrouped Data How are frequency tables used for ungrouped data? Frequency tables can be used for ungrouped data when you have lots of the same values within a data set They can be used to collect ...
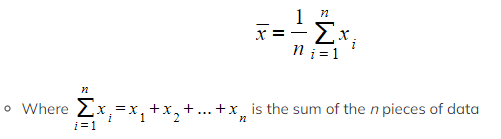
Mean, Mode, Median What are the mean, mode and median? Mean, median and mode are?measures of central tendency They describe where the centre of the data is They are all types of?averages In statist...

Edexcel IGCSE Physics 復習筆記 3.2.2 Reflection & Refraction Reflection & Refraction All waves, whether transverse or longitudinal, can be?reflected?and?refracted Reflection occurs w...


